
End the whole mess
End process tree captures every descendant before ending anything, so a supervisor can't respawn its children. End all instances takes down 40 chrome.exe processes with one confirmation.
For Windows 10, 11 and Server 2016+
Argus does everything Windows Task Manager does, and then the things you wished it did: process trees, end every instance in one go, fuzzy search, live visualizations, and a history that learns what's normal for your PC so it can tell you when something changes.
Free for personal and noncommercial use · 30-day commercial trial · No telemetry
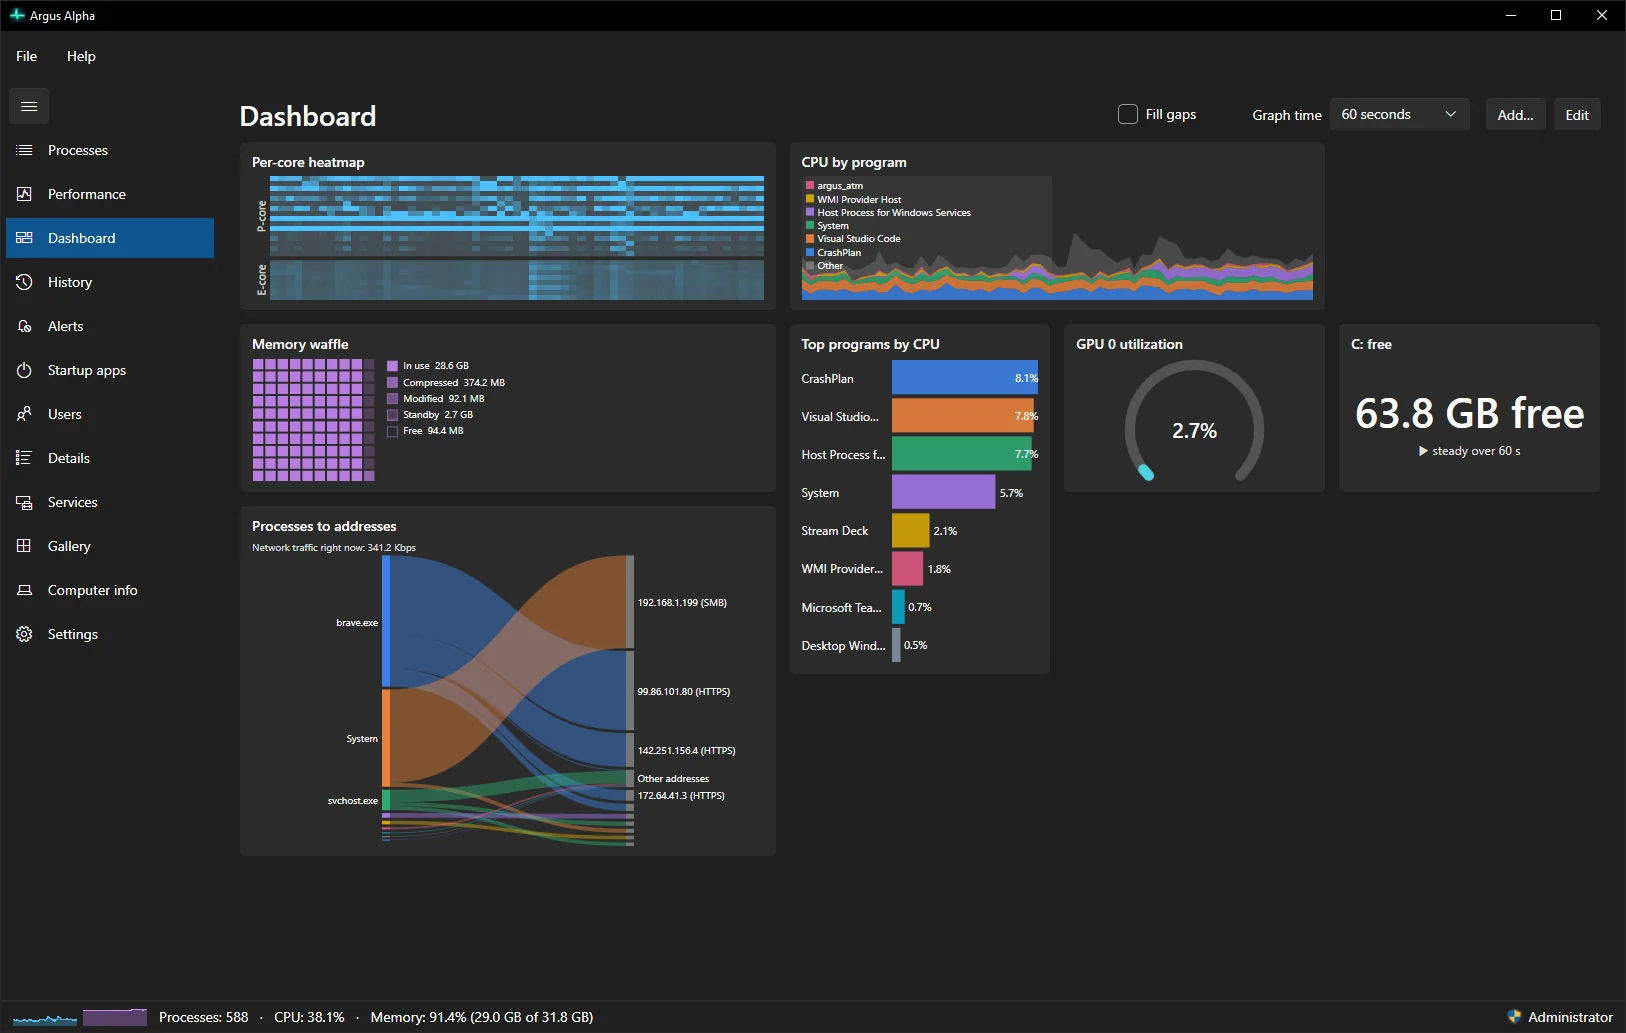
Point Ctrl+Shift+Esc at Argus with one click, and turn it back just as easily. Everything you reach for in Task Manager is there, usually with one more thing it should have had.
End process tree captures every descendant before ending anything, so a supervisor can't respawn its children. End all instances takes down 40 chrome.exe processes with one confirmation.
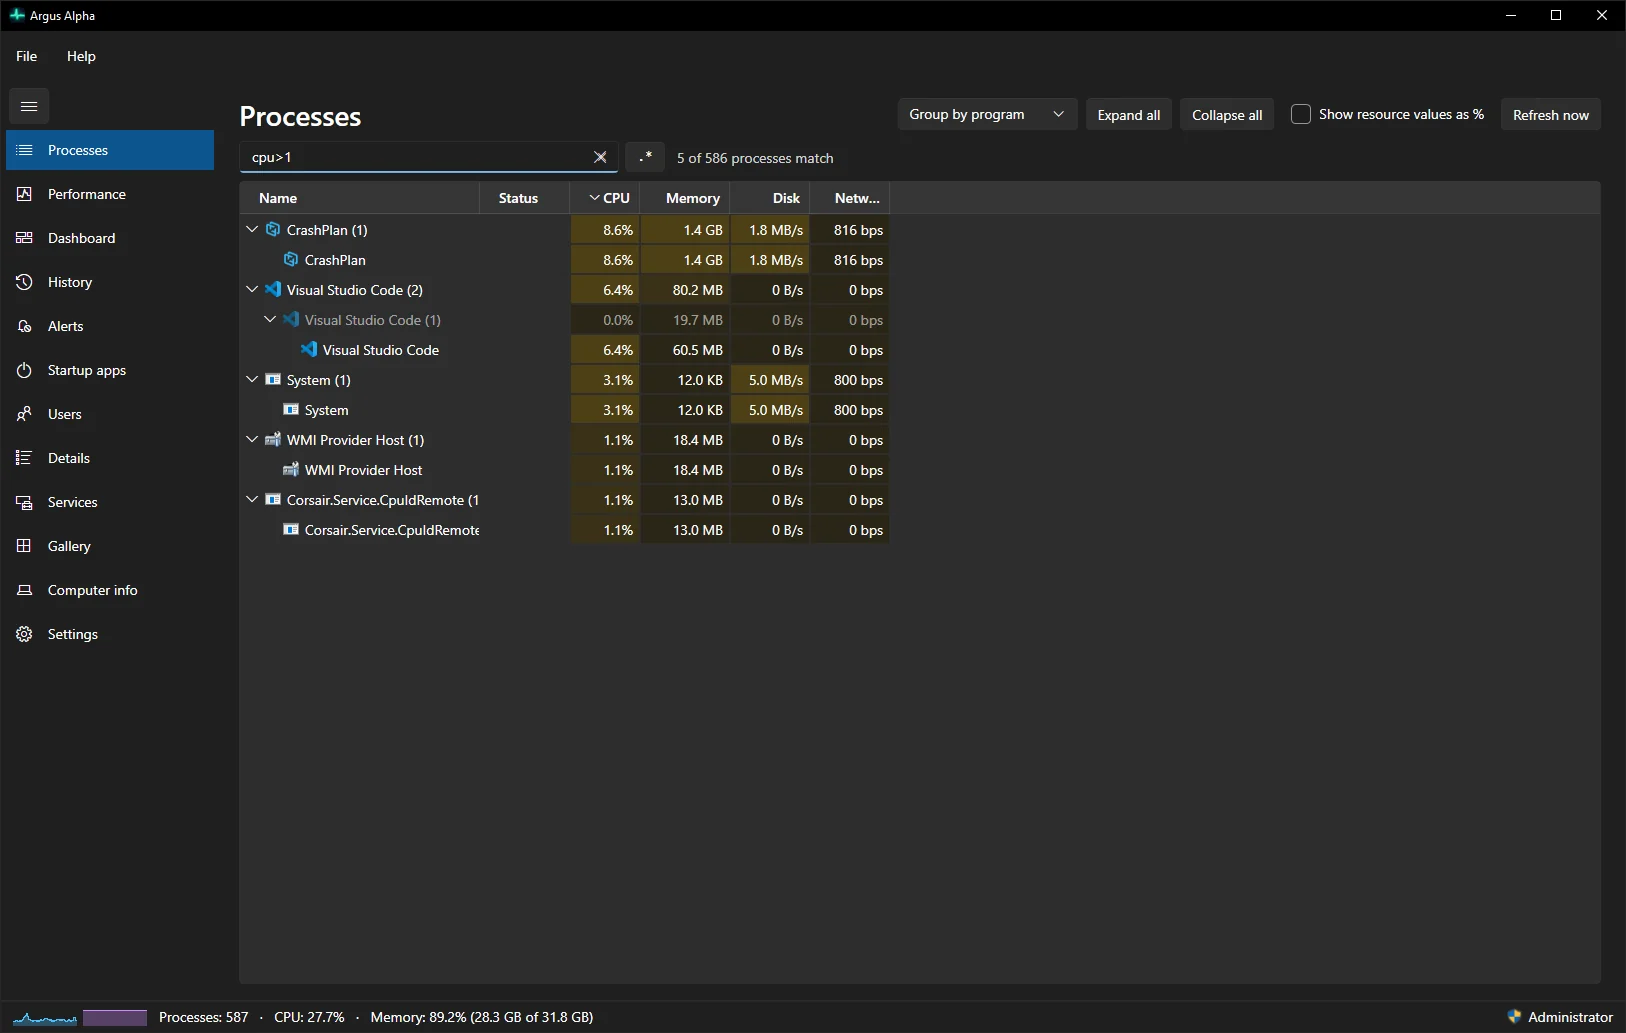
Start typing. Fuzzy matching over name, PID, publisher, path and command line, a regex toggle, and field filters like cpu>20, user:SYSTEM or exe:node.exe.
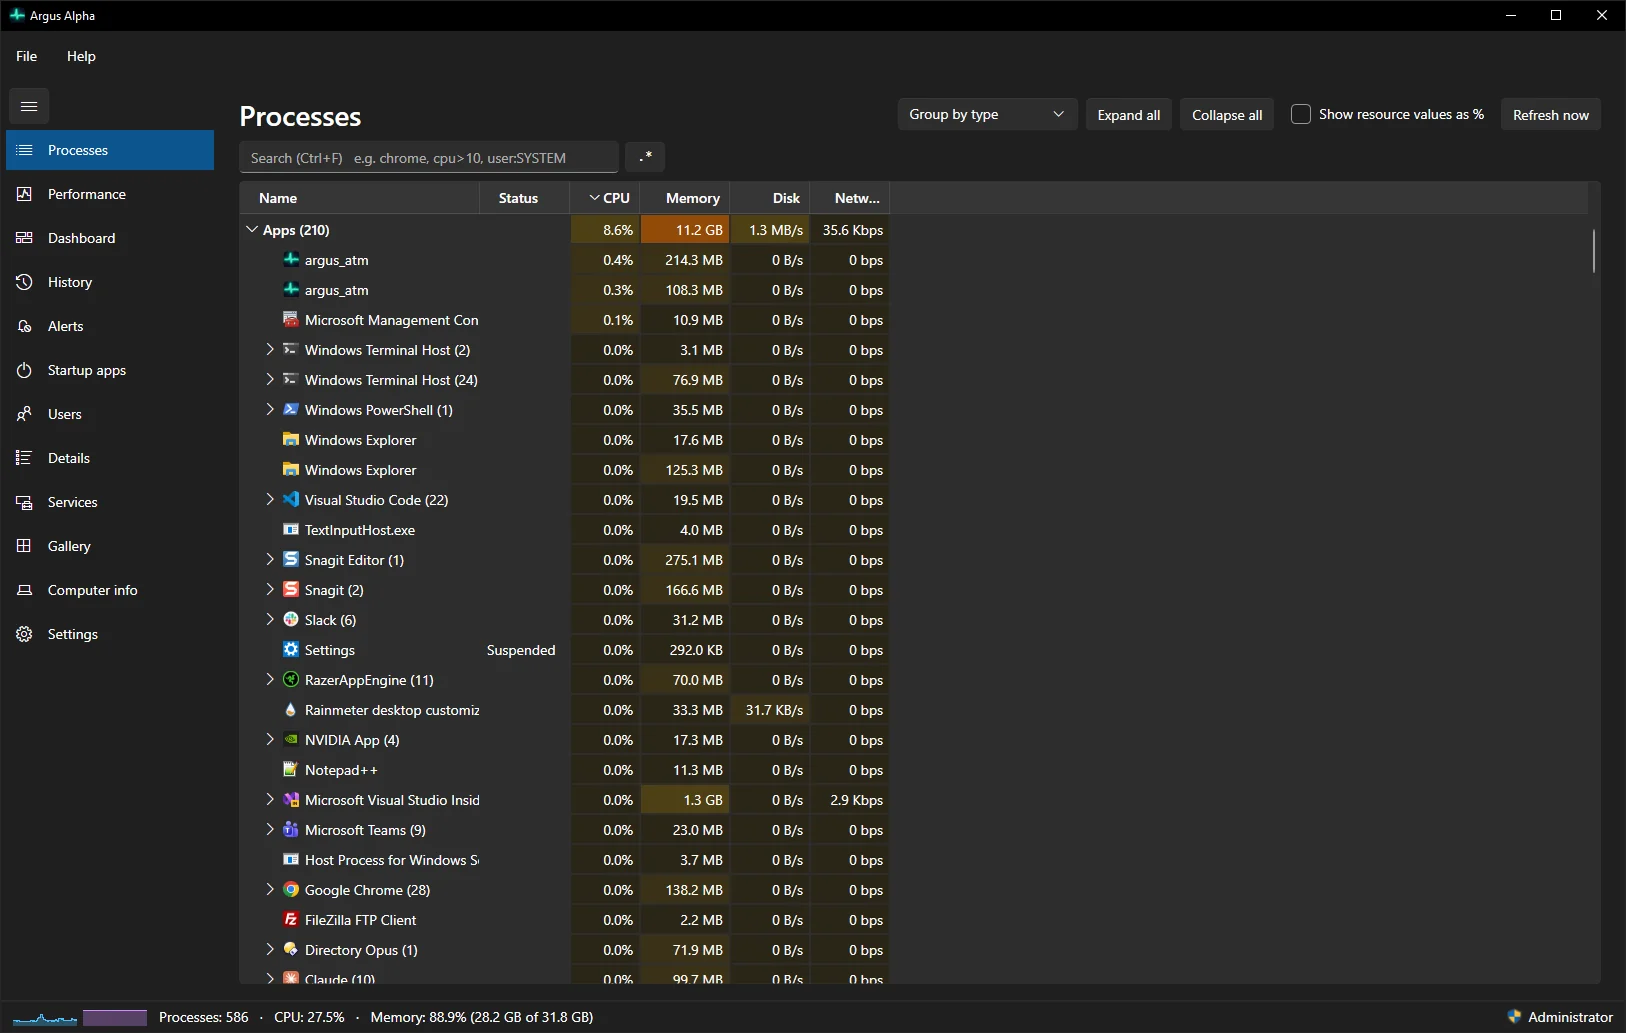
Group by type as Task Manager does, or view a true process tree that handles reused PIDs and orphans, or group by program with rolled-up CPU, memory, disk, network and GPU.
Any graph or tile opens in its own small window. Pin it on top, keep it on its own virtual desktop, and it comes back where you left it next time.
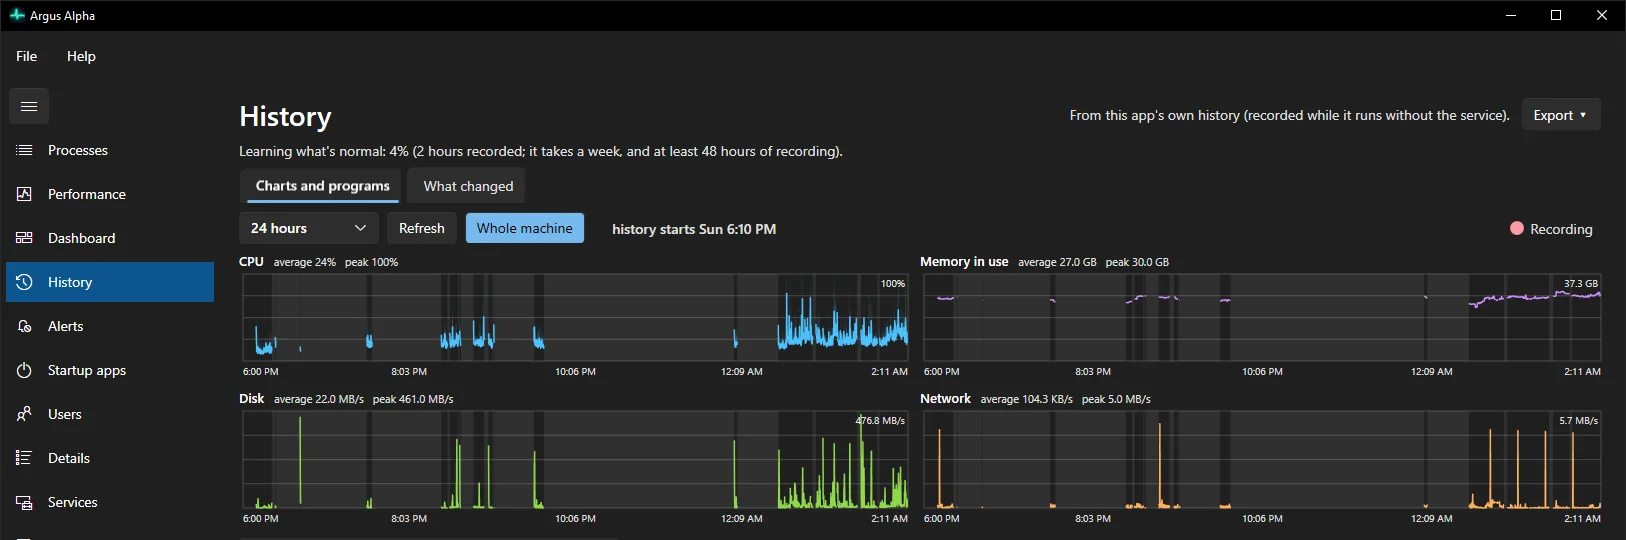
Local history for the machine and every program: 24 hours to 90 days, a "What changed" report between periods, and graphs that scroll back in time.
Alert rules with real Windows notifications: when a build finishes, when CPU stays high, when commit passes 90%. Cooldowns, quiet hours, snooze, and an optional webhook.
The part Task Manager can't do
Argus keeps a rolling baseline for every program on your machine: how much CPU, memory and I/O it usually uses, and the hours it's usually active. After a week of learning, it can point at the things that changed: a new process that's suddenly busy, memory that has only gone up for an hour, or a program running far outside its usual range.
Baselines are in testing now. The anomaly detectors and their dashboard are next on the roadmap.
Argus runs as you. Actions that need administrator show a shield, and Restart as administrator brings you back to the same page, filter and selection.
No accounts, no analytics, no cloud. The only network call Argus will make by default is a check for signed updates, and you can turn that off. Optional disk-cleaning definitions are downloaded only if you ask for them.
One system call per refresh for every process, with its own lightweight graph renderer instead of a charting library. It's built to stay under 1% CPU while you watch.
Features
Argus matches Windows Task Manager's Processes, Performance, App history, Startup, Users, Details and Services, then adds the tools that usually mean opening three other programs.
The familiar grid, with heat-map shading, values as absolute numbers or percentages, and sort, columns and expansion that are remembered. Rows update in place, so your selection and scroll position don't jump.
Ending one runaway process is easy. Ending a build tool's whole tree, or every copy of a browser, is where Task Manager leaves you clicking. Argus handles the whole group, and it's careful about what it touches.
svchost.exe before you end it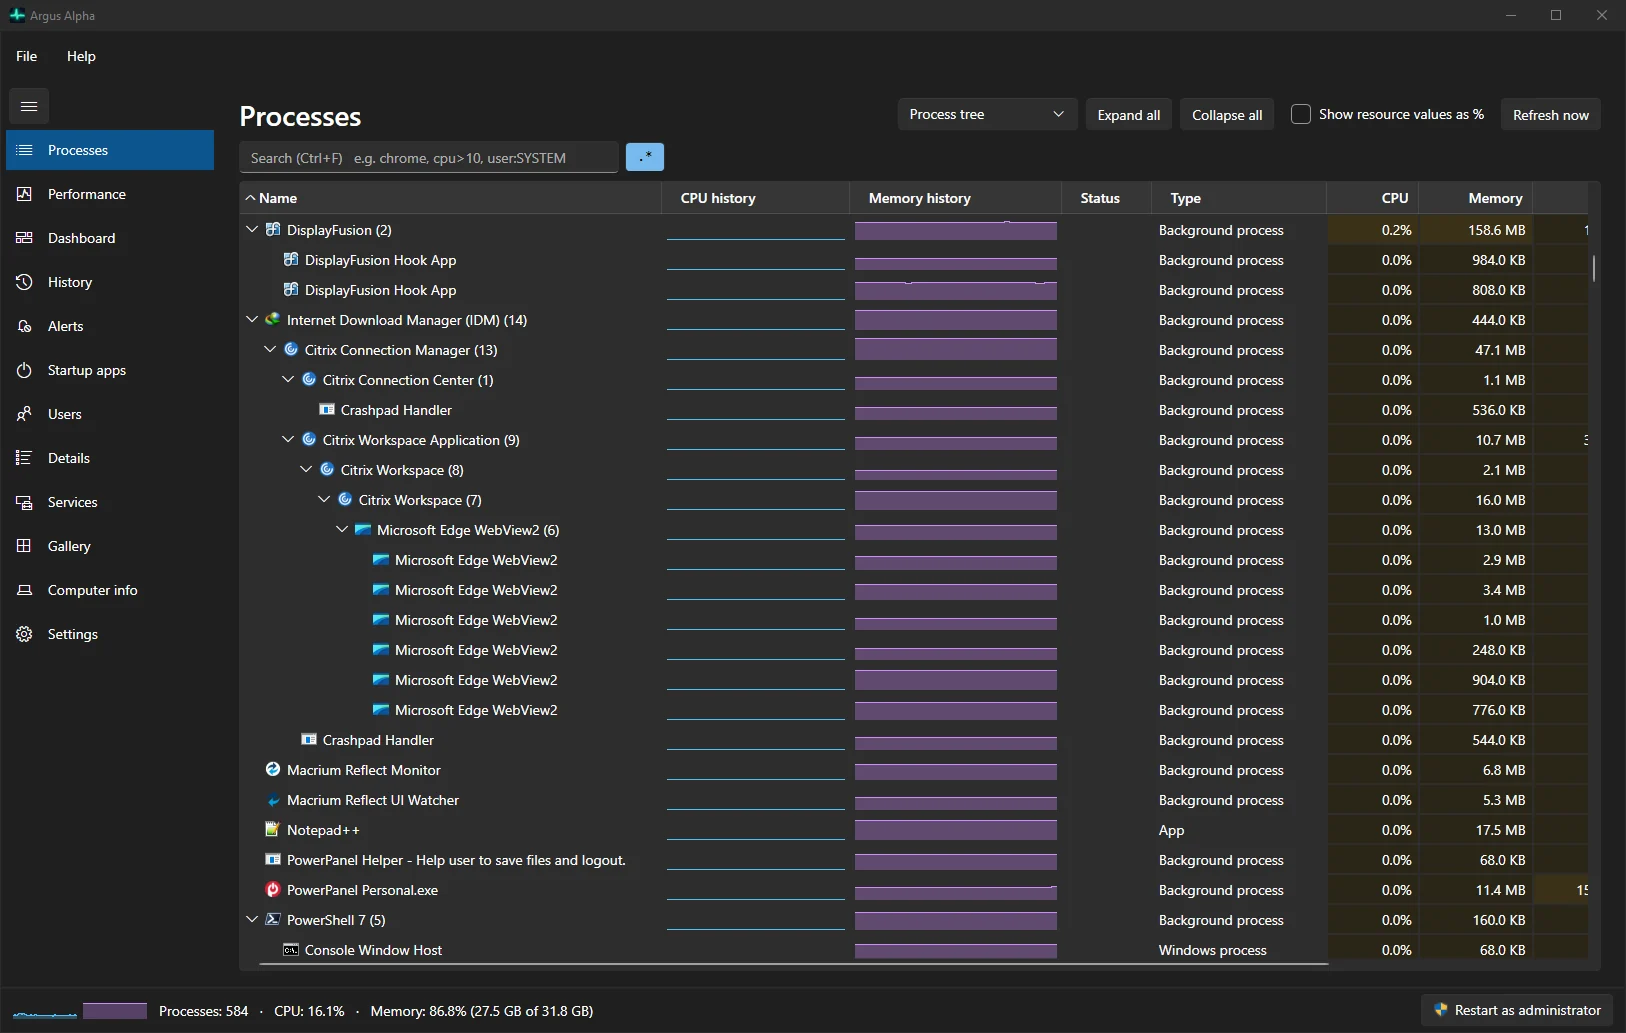
Press Ctrl+F or just start typing. Argus ranks fuzzy matches by quality and highlights what matched. It searches the name, PID, description, publisher, image path and command line.
cpu>20user:SYSTEMpath:tempexe:node.exe.* regex
Search works on the Processes, Details, Services and Startup pages. Combined with Ctrl+A and Del, it's the fastest way to clean up after a runaway script.
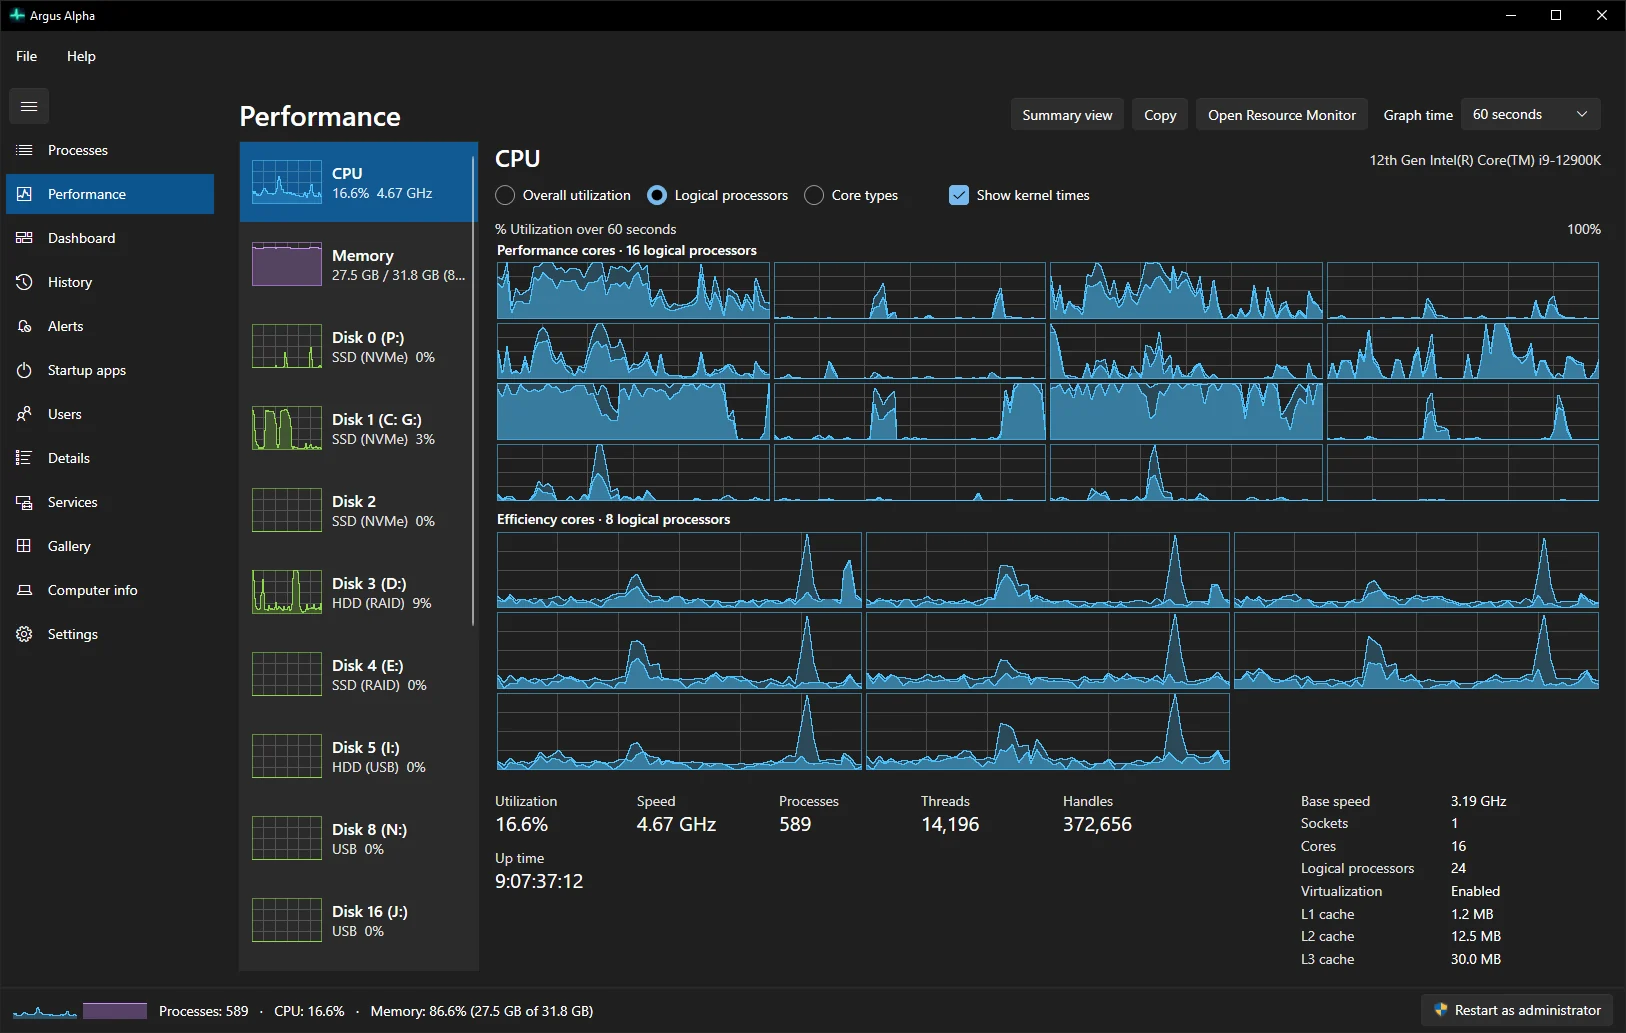
Every Task Manager graph and figure, for the CPU, memory, each physical disk, each network adapter and each GPU, plus a graph window of up to 5 minutes instead of 60 seconds.
Pick any visualization, give it a size on a grid, and put it in order. Argus flows the tiles into the width you have: in strict order, or filling gaps so the page stays full.
Some tiles show the whole machine. Others watch one thing you choose: a disk, a drive letter ("GB free on D:"), a GPU's temperature, a network adapter or a program. If a drive is unplugged, its tile says so and waits for it to come back.
Every tile pops out into its own window. Or describe the dashboard you want to an AI assistant and let it build it.
Argus records what your machine did in a local SQLite database: 10-second detail for 48 hours, then minute, quarter-hour and daily summaries for up to a year, capped at a size you choose.
Argus includes an MCP server, so Claude, Copilot, ChatGPT and other assistants can answer questions about this computer from Argus's live figures and its history, and build dashboards for you. They can look, but not touch: nothing an assistant asks for ends, changes or starts a process.
What's busy now, the spikes in the last stretch of time, and the programs behind them, in plain language.
Argus's own analysis engine works out averages, percentiles, trends, correlations, spike causes and comparisons with the 7-day baseline, so the assistant reasons over answers.
"Is Teams leaking memory?" uses the leak detector's own fit. "What changed since last week?" compares two periods program by program.
"Make a Drives dashboard with a sparkline for every disk." The assistant checks your hardware, builds it and shows it. Every change comes with an Undo notification, and nothing is ever deleted.
It runs as you, sees less than you do, never gets command lines unless you allow them, and logs every request on your PC. You can turn it off, and so can an administrator.
Claude Code, Claude Desktop, VS Code and Visual Studio with Copilot, Cursor, ChatGPT's desktop app and more. You add Argus to it once.
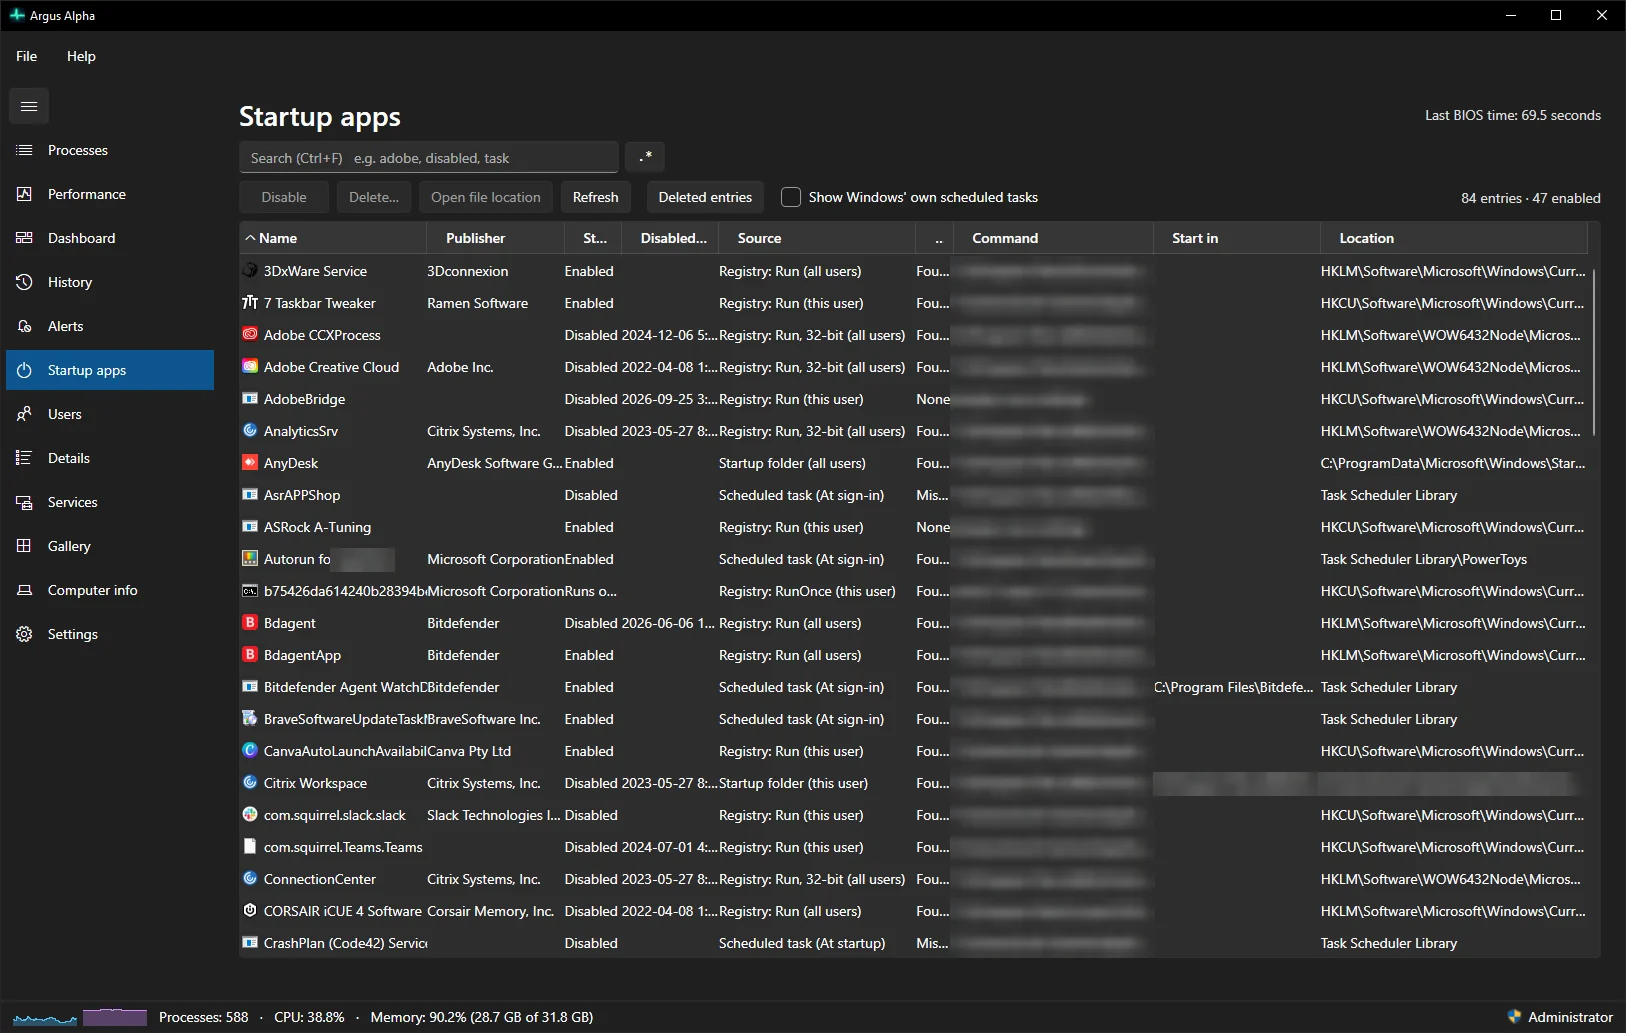
Startup apps lists more than Task Manager does: the Run and RunOnce keys (32- and 64-bit), both Startup folders, and scheduled tasks that start at sign-in or boot. It shows whether each target still exists. Enabling and disabling uses the same mechanism as Windows, so Task Manager and Settings agree. Deleting keeps a backup you can restore. It also shows the last BIOS time.
Services can be started, stopped, restarted and switched between startup types, and you can jump to each one's process. Users shows each session's totals, with Disconnect, Sign off and Send message.
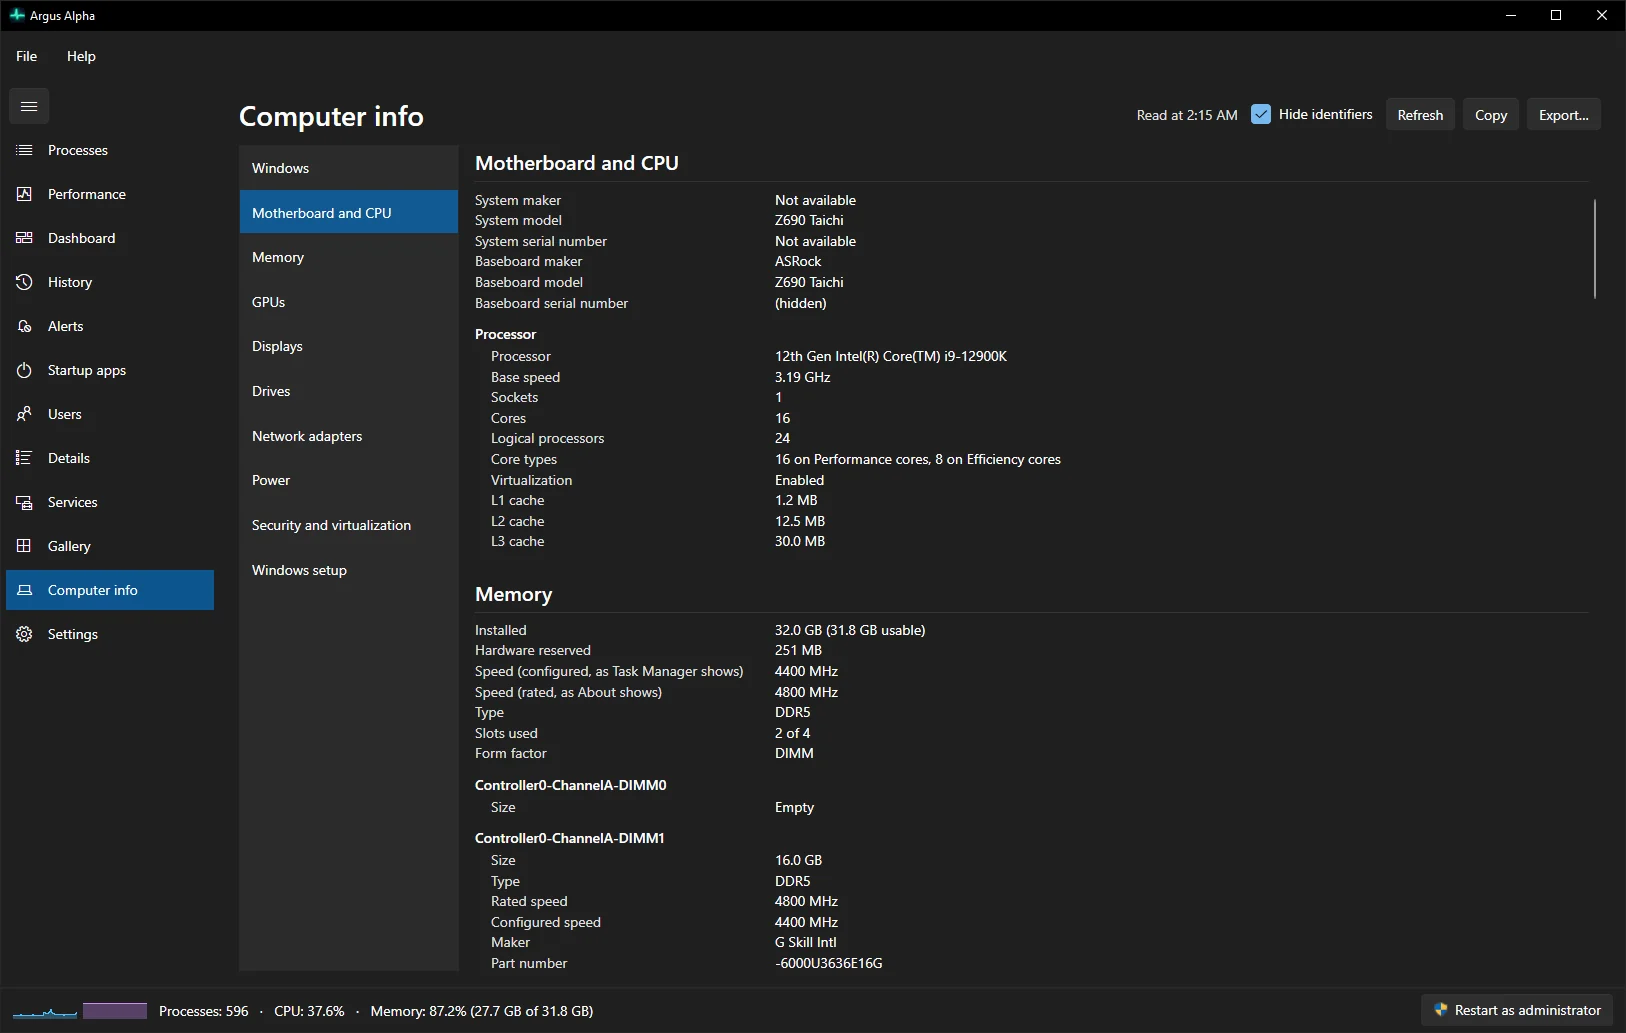
One scrolling report of the whole machine: Windows edition and build, motherboard and CPU, every memory module (with both the rated and the configured speed), GPUs, displays, drives with their volumes, network adapters, power and battery wear, Secure Boot, TPM, virtualization-based security, antivirus and firewall, and installed .NET runtimes.
Copy it, or export it as text, Markdown or JSON. Hide identifiers blanks serial numbers, device IDs and MAC addresses, so you can post it in a forum or a support ticket.
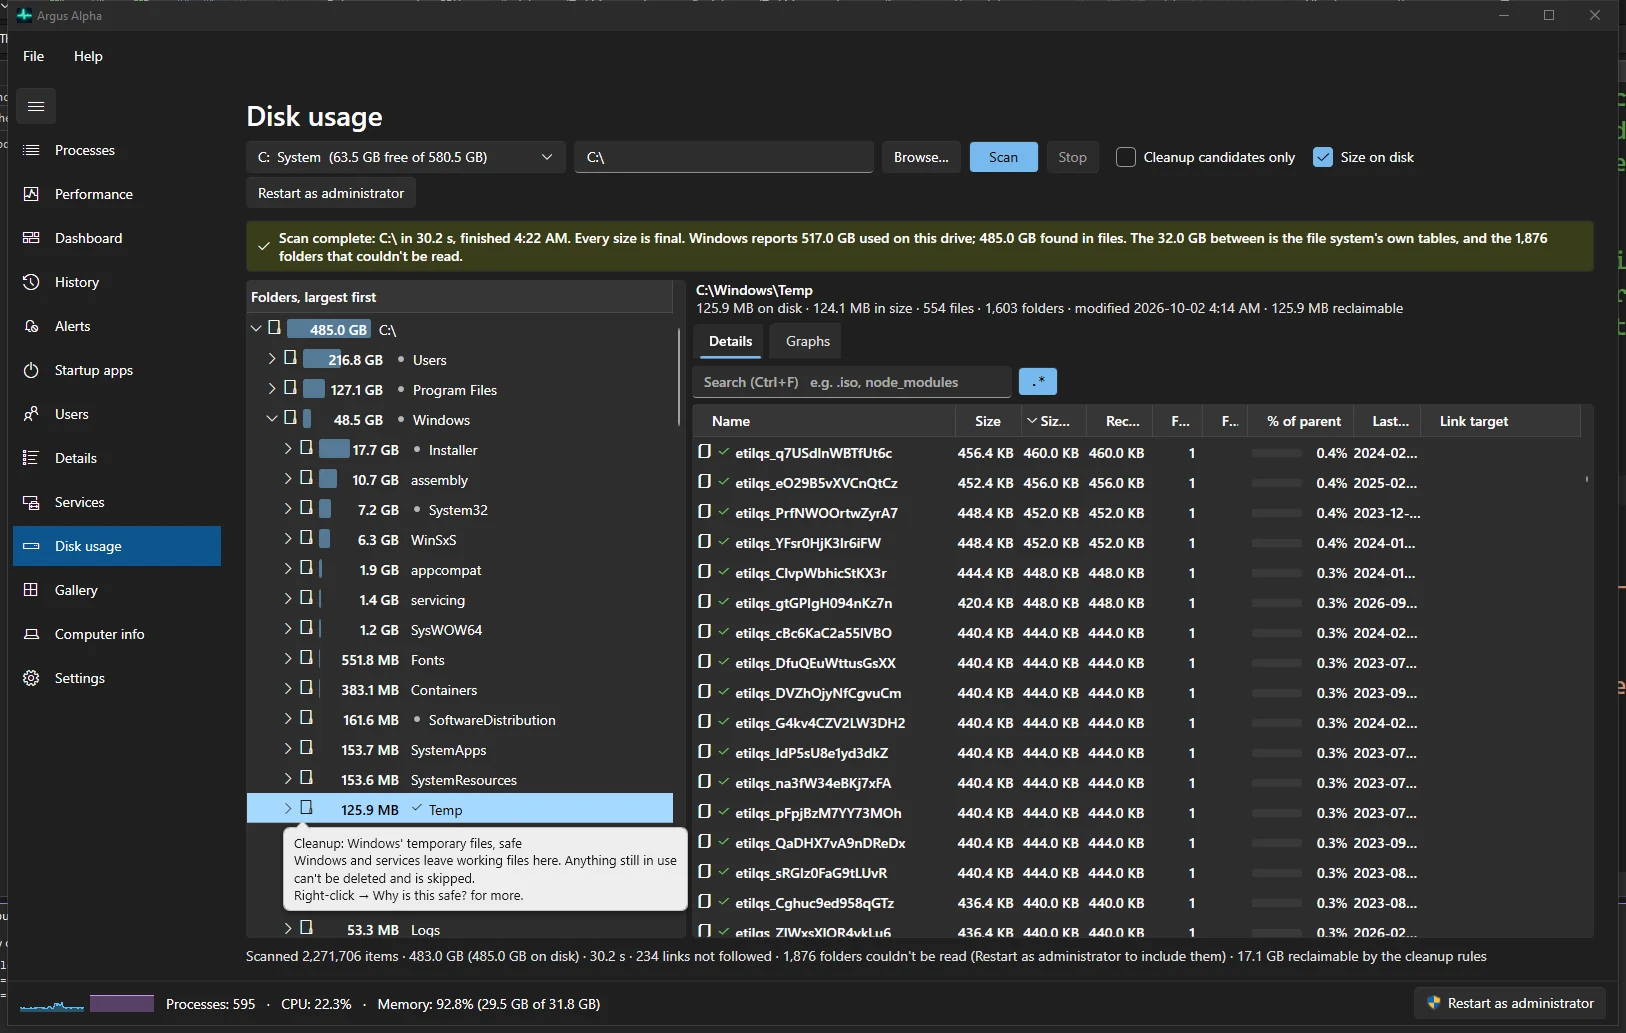
Scan a drive or any folder and see exactly where the space is. The folder tree sorts everything largest first, so the answer is usually one or two clicks away. A chart — ranked bars, treemap or pie — fills the right pane for whatever you select, a Files tab lists the largest files anywhere under it, and a Results tab sums up the drive and what could be cleaned up. Each scan opens in its own tab, so you can keep several drives side by side.
One switch makes Ctrl+Shift+Esc, Ctrl+Alt+Del, the taskbar menu and Win+X open Argus. One more switch undoes it, and uninstalling always puts Task Manager back.
Del ends a task, Shift+Del ends the tree, Ctrl+Shift+Del ends all instances, F5 refreshes, and a help overlay lists the rest. Screen readers get proper names and roles throughout.
Drop a file on the window to see which processes hold it open. No administrator rights are needed for your own processes.
The built-in Disk analysis tab scans a drive or folder — in seconds as administrator — sorts everything largest first, and flags the files and folders you can safely remove, the disk images you can compact, and the system files to leave alone.
General info, 5-minute mini graphs, modules, threads, network connections and environment variables. You can also analyze the wait chain, create a dump file or toggle UAC virtualization.
Start minimized or only in the tray, with your pinned pop-outs showing. Use --profile to run a separate copy with its own settings.
Follows Windows light or dark mode, has a compact density, and the navigation collapses to icons or moves across the top. Fewer details mode is a tiny list of apps.
| Feature | Task Manager | Argus |
|---|---|---|
| Processes, Performance, Startup, Users, Details, Services | Yes | Yes |
| Process tree view | No | Yes |
| Group by program, with totals | Apps only | Every program |
| End all instances of a program | No | Yes |
| End process tree | Yes | Yes, and safe with reused PIDs |
| Fuzzy search, regex, field filters | Basic search | Yes |
| Graph time window | 60 seconds | Up to 5 minutes, and back into history |
| Pop-out, pin-on-top graphs | Summary view | Any graph or tile |
| Custom dashboard and 30+ visualizations | No | Yes |
| History | App history (30 days, CPU and network) | Every program, up to a year |
| Alerts and notifications | No | Yes |
| Scheduled-task startup entries | No | Yes |
| Computer info report with export | No | Yes |
| History from boot, before anyone signs in | No | With the optional service |
| Ask an AI assistant about the PC and its history | No | Claude, Copilot, ChatGPT and others, through MCP |
| Find which process is locking a file | No | Drop the file on the window |
| Disk space analysis | No | Folder tree, charts, largest files; a whole drive in seconds as administrator |
| Cleanup suggestions | No | Explained item by item, with the right tool for each |
| Recycle or delete from the analysis | No | Yes, with a Never delete list |
| Startup impact | Yes | Not yet (planned) |
| Efficiency mode | Windows 11 | Not yet (planned) |
| Per-process network as a standard user | Yes | With the optional service, or as administrator |
We'd rather tell you about the gaps than have you find them. Startup impact and Efficiency mode depend on undocumented parts of Windows, so they're scheduled for later, with extra testing.
Visualization gallery
The Gallery page shows every visualization in Argus live on your own data. Double-click any of them to pop it out, or add it to your dashboard. Each is drawn by Argus's own lightweight renderer, so they stay sharp at any DPI and cheap over Remote Desktop.
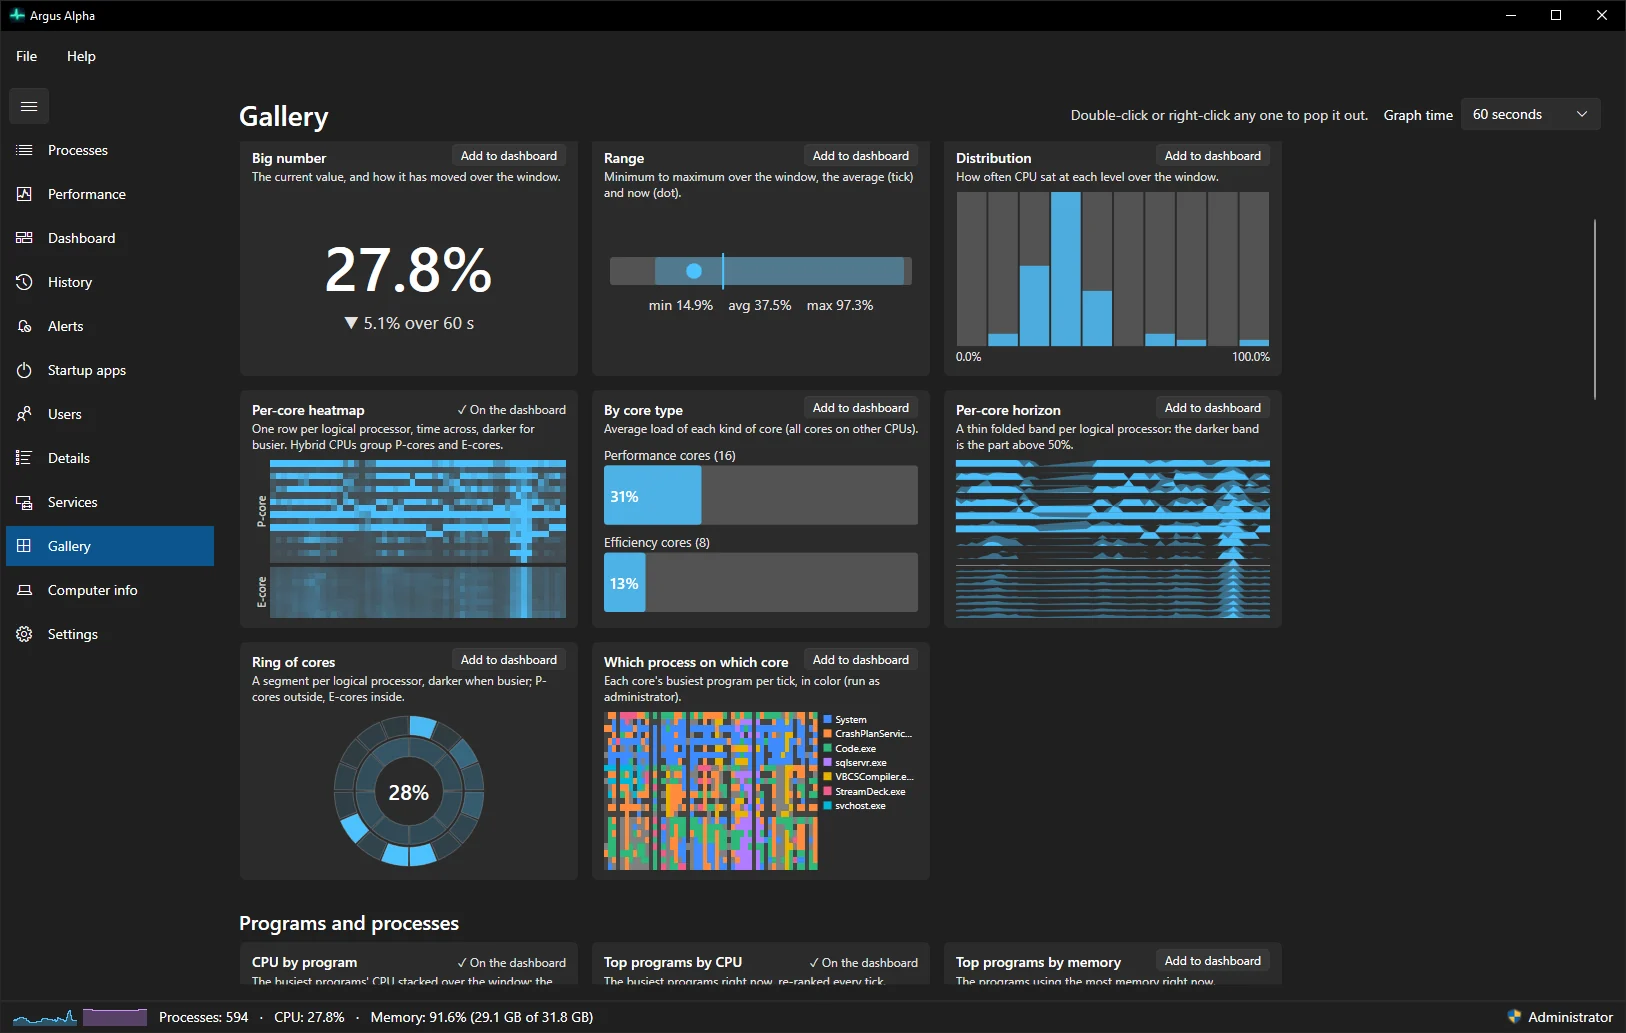
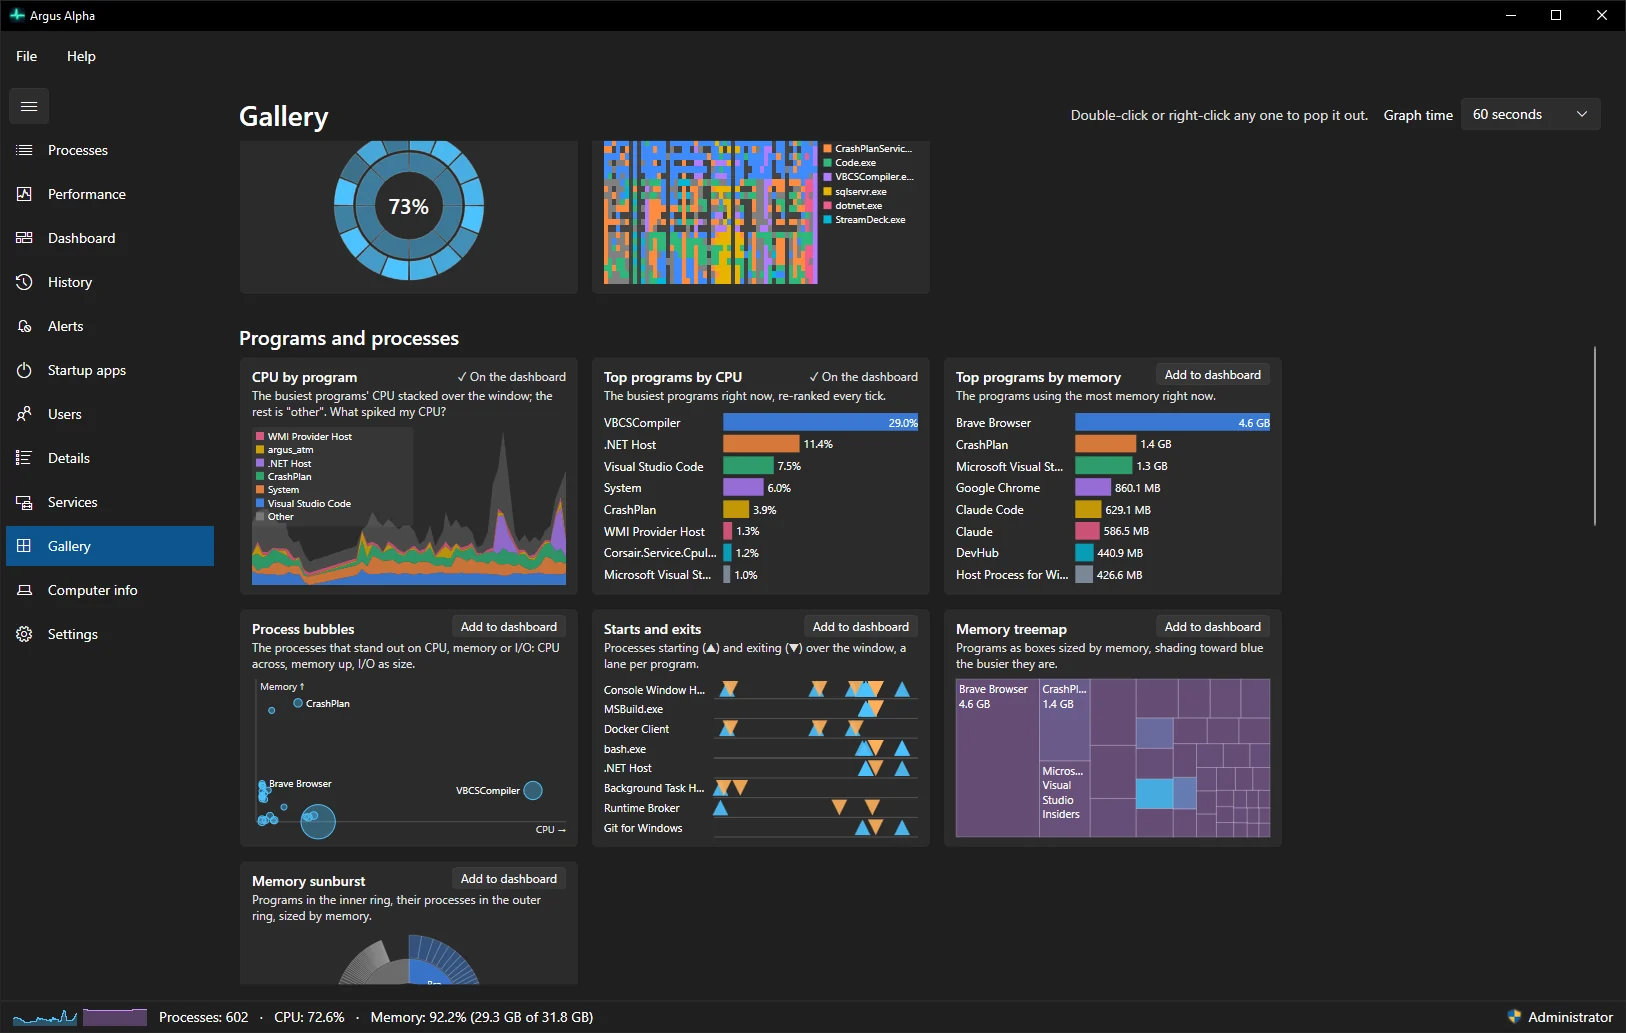
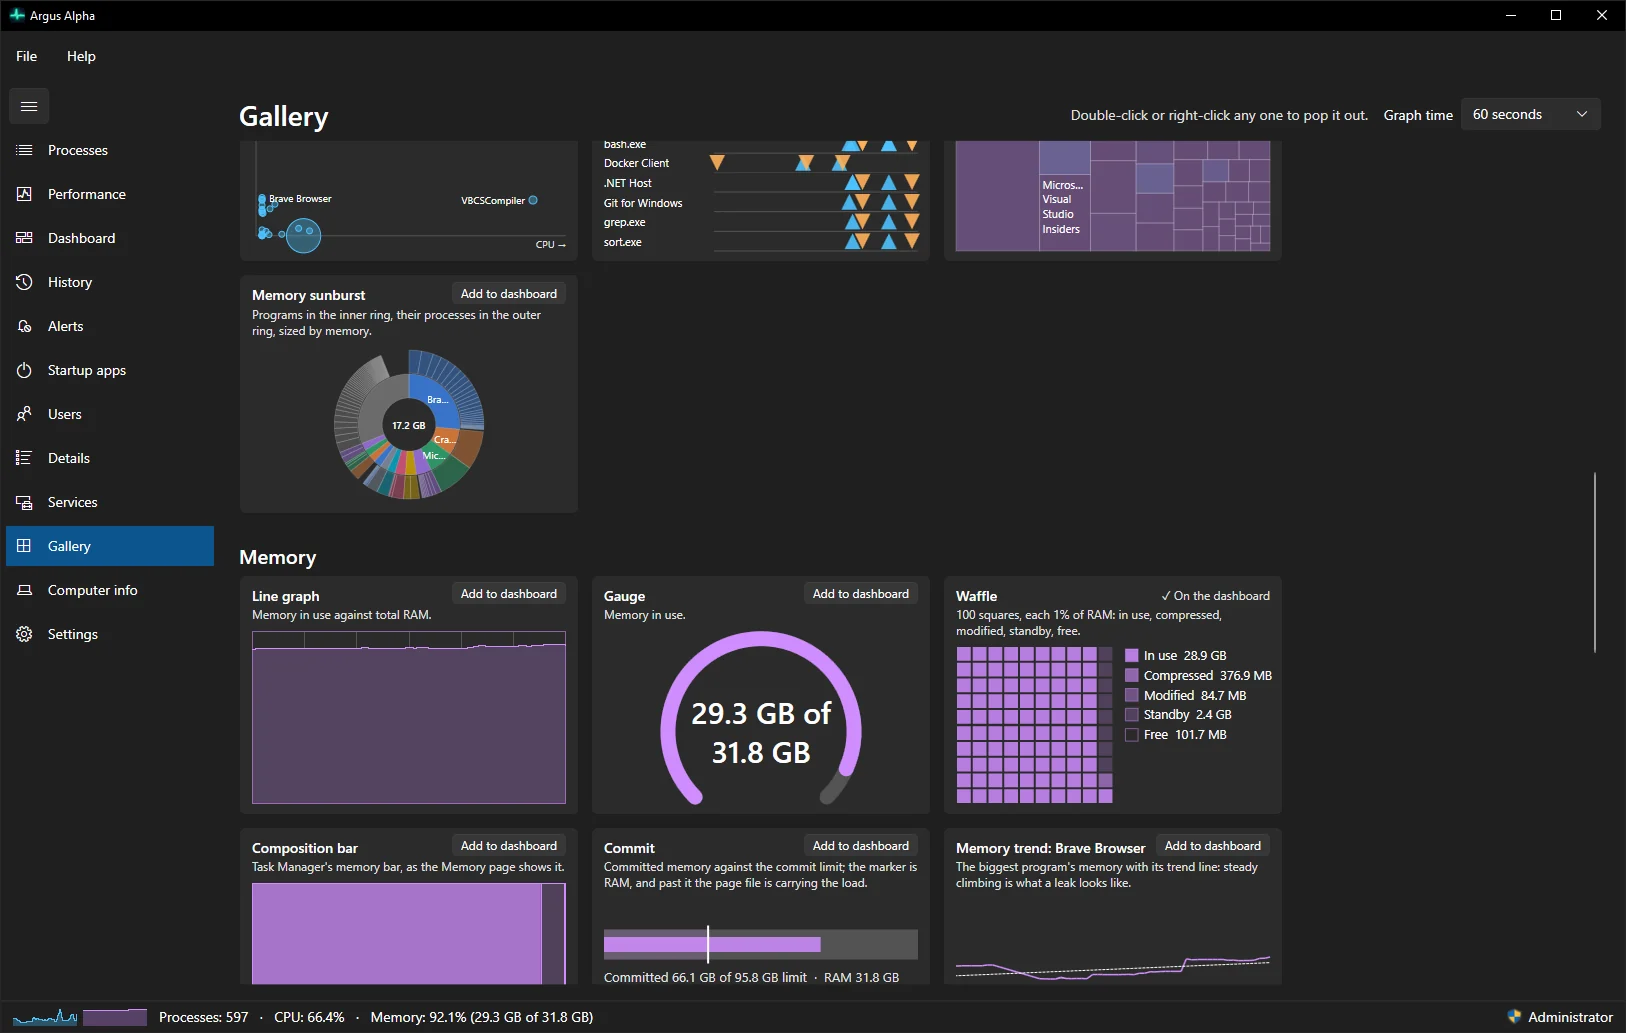
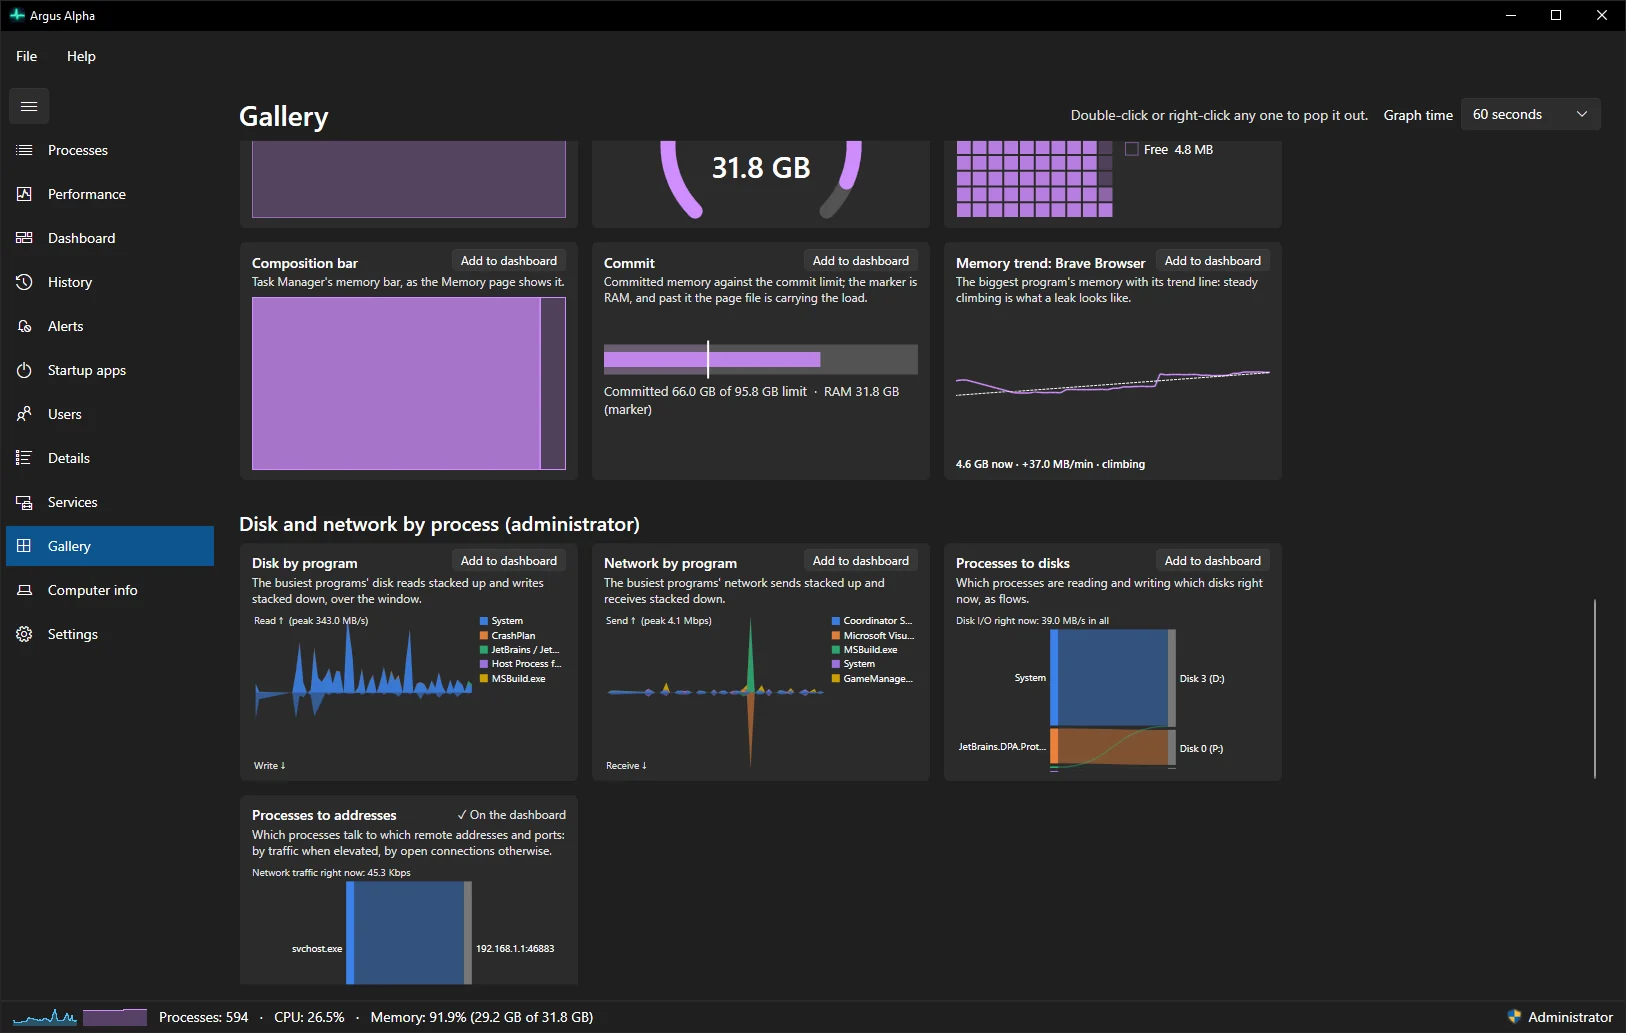
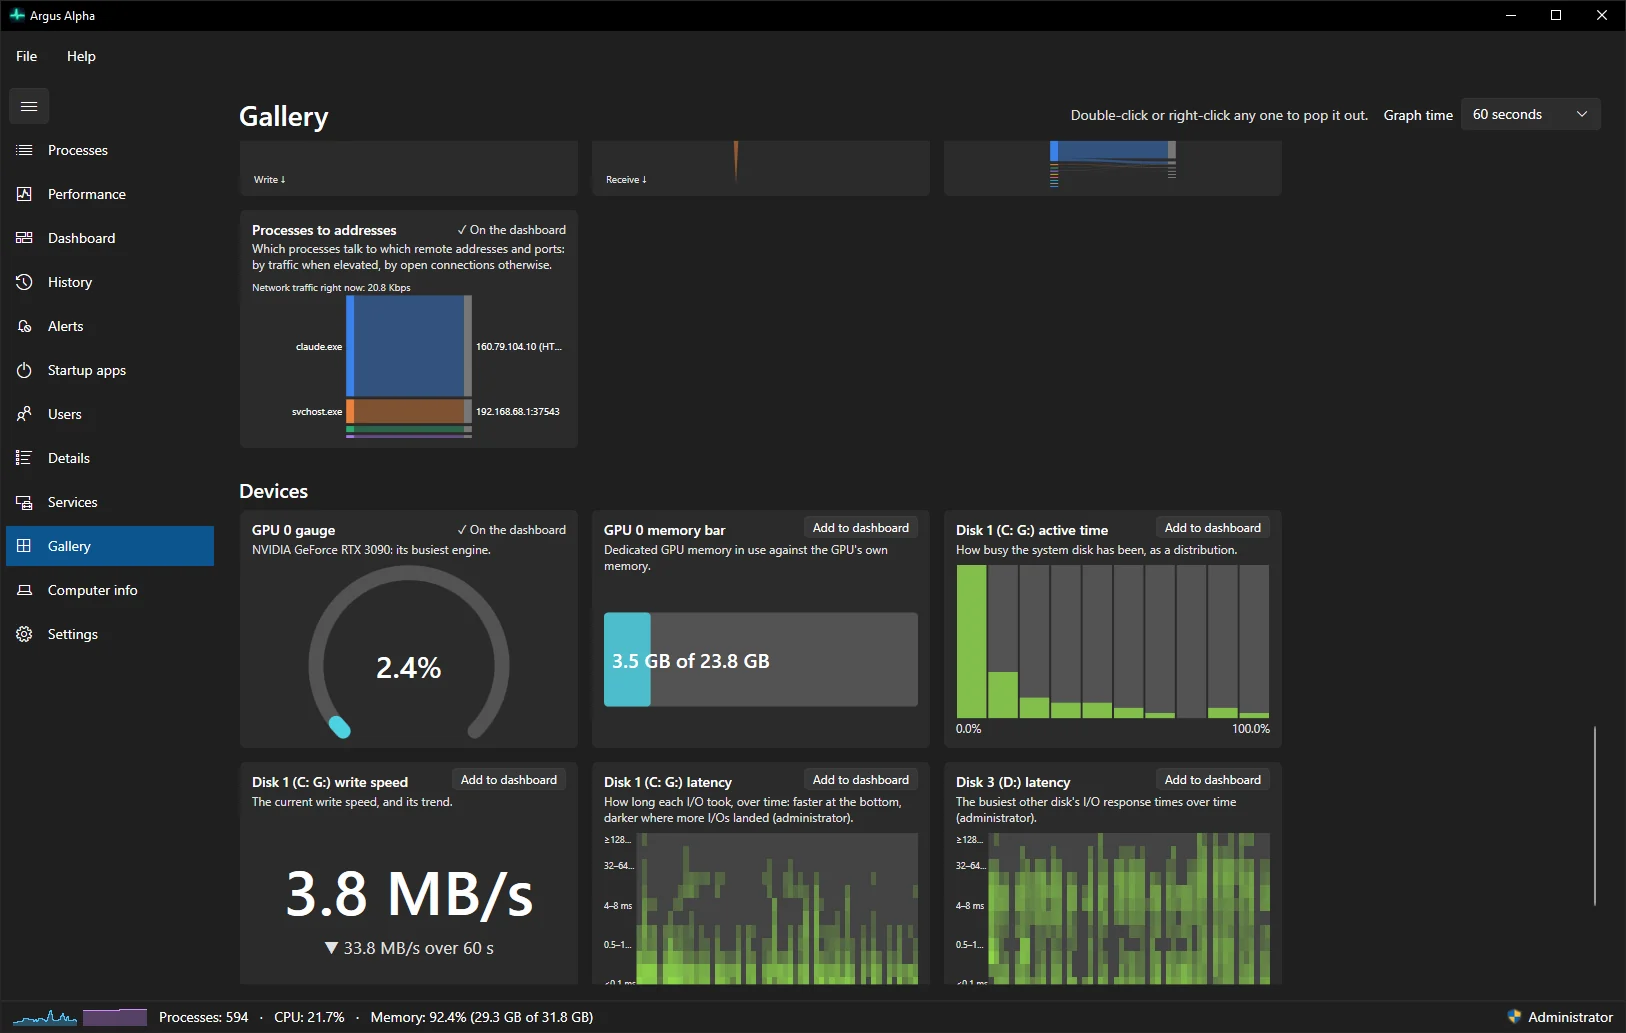
Every visualization is a self-contained piece with its own data feed. The same one can sit in the Gallery, on your dashboard and in three pinned pop-outs at once, and each keeps updating while the main window is minimized.
Some visualizations need data only an administrator can collect, such as per-process disk and network, core-by-core process sampling and disk latency. As a standard user they say so and offer to restart elevated. The optional service provides disk and network for everyone.
All screenshots →Screenshots
Taken from a real machine running the current beta, in dark mode. Click any image to enlarge it; use the arrow keys to move between them.
Roadmap
The plan is simple: first replace Task Manager for daily use, then do what it can't, which is learning what's normal for a machine and flagging when something changes.
Phase 1 · Finishing
Parity with every Task Manager tab, plus the cheap wins: tree view, end all instances, fuzzy search, pop-outs, the dashboard and the visualization gallery, computer info, Task Manager replacement.
Phase 2 · In progress
"What changed, and is it a problem?"
Phase 3 · Planned
A process knowledge base (what is this, and is it safe to end?), groups and saved workspaces, process comparison, .NET runtime insights, handle search, a dependency map, custom themes, and Restart for apps that can be restarted safely.
Phase 4 · Finishing
Find out where the space went, without leaving Argus. The analyzer is built; a final cleanup test on a fresh virtual machine is all that's left.
Later · Considering
Features that rely on parts of Windows Microsoft doesn't document: Startup impact, Efficiency mode, job objects and Task Manager's compressed-memory figures. Each gets its own fallbacks and testing on every supported version.
IT administration (remote monitoring, policies, a PowerShell module) may follow if there's demand.
Download
Argus is in beta: it's in daily use and being tested before its 1.0 release. The installer is signed by 42 Degrees Design, LLC.
On older builds, features that need newer Windows are hidden or labeled "Not available on this version of Windows"; they never show a blank or an error.
Argus's updater is being designed so that even a fully compromised web or download server can't get you to install something we didn't sign:
Binaries are hosted on GitHub Releases, not on this website. Trust rests on the signatures, not on where the file came from. Also planned: a winget package.
Argus is licensed under the Prosperity Public License:
About
In Greek myth, Argus Panoptes had a hundred eyes and never closed them all at once, which made him the perfect guard. Argus the app is a watchman for your PC: it shows you everything that's running now, and it remembers what normal looks like.
Windows Task Manager is good at telling you what's happening right now. It doesn't know what happened an hour ago, what a program usually does, or that a process which never used to wake up is now busy all night. Power tools like Process Explorer go deep, but they're built for investigation, not for leaving open all day.
Argus aims for the middle: a Task Manager you can use every day, with the extra tools close at hand and a memory built in. It deliberately doesn't try to be an antivirus, a kernel debugger or a malware-analysis tool.
Argus doesn't phone home. There are no accounts, no analytics and no crash uploads. Nothing leaves your machine unless you configure it, for example by adding a webhook for alerts, or connecting an AI assistant (whose provider receives what it asks Argus, without command lines unless you allow them). Turning on the optional BleachBit or Winapp2.ini cleaning definitions downloads them from GitHub (a plain file download that sends nothing about you); they're off by default. The update check, once it ships, will be the only default network call; it will send no identifying data, and you'll be able to turn it off in Settings or by policy. History can be paused, purged or told to ignore programs. Command lines are stored only if you allow it, and anything that looks like a password, token or key is removed first.
Argus is released under the Prosperity Public License by 42 Degrees Design. You may use and share it for free for noncommercial purposes, which includes personal use, hobby projects, research and study, and use by charities, educational institutions, public research, public safety and health organizations, and government. Commercial use gets a thirty-day trial per company. The software comes as is, without warranty.
Argus is made by 42 Degrees Design.
AI assistants
Argus comes with an MCP server, so an AI assistant such as Claude Code, VS Code or Claude Desktop can ask about this computer, now and in its history, get statistical summaries no graph shows you at a glance, and build dashboards from a sentence. It can look, but it can't touch: no tool ends, changes or starts anything.
The numbers come from Argus's own analysis engine: averages, percentiles, trends, peaks and the shape of the curve, sized for the question, with a note on how exact they are. The assistant reasons over summaries, not thousands of raw points.
argus-mcp.exe is installed next to Argus. Argus doesn't change any assistant's settings itself: you add it to your assistant once. Connecting an assistant has the steps for Claude Code, Claude Desktop, VS Code, Visual Studio, Cursor, ChatGPT and more.
The server also offers four ready-made prompts, which most assistants list as commands: why_slow, build_dashboard, program_report and what_changed.
Whatever a tool returns is sent to the assistant's provider, so the assistant sees less than you do:
%LOCALAPPDATA%\Argus\logs\mcp.log.You can turn assistants off, or stop them changing dashboards, in Settings → AI assistants. An administrator can turn them off for everyone on the computer. There's no tool that deletes a dashboard: an assistant can rename one "(archived)" for you to delete.
With the Argus service running, the assistant can answer from history even while the Argus app is closed. Without it, the app must be running, and the history is what the app recorded while it ran. Dashboard requests start Argus in the tray if it isn't open.
AI assistants
Any assistant that can run a local MCP server can use Argus. You add it once; the assistant then starts argus-mcp.exe itself whenever it needs it. Find yours below.
C:\Program Files\Argus\argus-mcp.exe; the steps below use that path. If you installed Argus somewhere else, Settings → AI assistants in Argus shows where yours is, with the Claude Code, VS Code and Claude Desktop lines ready to copy.--profile? Add --profile name as an argument to the server, the same way, so the assistant talks to that copy.In a terminal (not inside a Claude session):
claude mcp add --scope user argus -- "C:\Program Files\Argus\argus-mcp.exe"--scope user makes Argus available in every folder; leave it out to add it to the current project only. In a new session, /mcp shows whether it connected. The four prompts are slash commands such as /mcp__argus__why_slow. This works the same in Claude Code's VS Code and JetBrains extensions.
In Claude Desktop, open Settings → Developer → Edit Config. That opens %APPDATA%\Claude\claude_desktop_config.json. Add Argus to mcpServers (if the file already has other servers, add the "argus" entry beside them):
{
  "mcpServers": {
    "argus": {
      "command": "C:\\Program Files\\Argus\\argus-mcp.exe"
    }
  }
}
Quit Claude Desktop completely (from its tray icon, not just the window) and start it again. Argus then appears under the + button's Connectors.
Run MCP: Open User Configuration from the Command Palette (Ctrl+Shift+P) to add Argus for every workspace, or create .vscode/mcp.json for one:
{
  "servers": {
    "argus": {
      "type": "stdio",
      "command": "C:\\Program Files\\Argus\\argus-mcp.exe"
    }
  }
}
Then switch Copilot Chat to Agent mode. Argus's tools are in the tools picker.
Visual Studio 2022 17.14 or later, or Visual Studio 2026. Create %USERPROFILE%\.mcp.json to add Argus for every solution (or .mcp.json in a solution's folder for that solution only):
{
  "servers": {
    "argus": {
      "type": "stdio",
      "command": "C:\\Program Files\\Argus\\argus-mcp.exe"
    }
  }
}
Or, in Copilot Chat, switch to Agent mode, select Tools, then +, and enter the command there. New tools start turned off: tick Argus's in the tools list. The prompts are under + Add Reference → Prompts → MCP prompts.
Create or edit %USERPROFILE%\.cursor\mcp.json (or .cursor\mcp.json in a project):
{
  "mcpServers": {
    "argus": {
      "type": "stdio",
      "command": "C:\\Program Files\\Argus\\argus-mcp.exe"
    }
  }
}In the ChatGPT desktop app, open Settings → MCP servers → Add server, choose STDIO, and enter C:\Program Files\Argus\argus-mcp.exe as the command. The desktop app, the Codex CLI and the Codex IDE extension share one configuration, so adding it in one adds it to all. From a terminal:
codex mcp add argus -- "C:\Program Files\Argus\argus-mcp.exe"Or add it to %USERPROFILE%\.codex\config.toml yourself (single quotes keep the backslashes as they are):
[mcp_servers.argus]
command = 'C:\Program Files\Argus\argus-mcp.exe'gemini mcp add --scope user argus "C:\Program Files\Argus\argus-mcp.exe"Or add the same mcpServers entry as Claude Desktop's to %USERPROFILE%\.gemini\settings.json.
Open Settings → Tools → AI Assistant → Model Context Protocol (MCP), click Add, choose STDIO, and paste:
{
  "mcpServers": {
    "argus": {
      "command": "C:\\Program Files\\Argus\\argus-mcp.exe"
    }
  }
}
Choose Global to have it in every project, then OK and Apply. The Status column shows when it's connected.
Cline, Roo Code, LM Studio, Zed, Goose and many others run local MCP servers too. Most take the same mcpServers entry as Claude Desktop, in their own settings file; look for "MCP servers" in their settings. Whatever the format, the server is a stdio (local command) server, the command is the path to argus-mcp.exe, and it needs no arguments, environment variables or keys.
"C:\Program Files\Argus\argus-mcp.exe" --version in a terminal. In a JSON file, every backslash in the path is written twice.%LOCALAPPDATA%\Argus\logs\mcp.log.